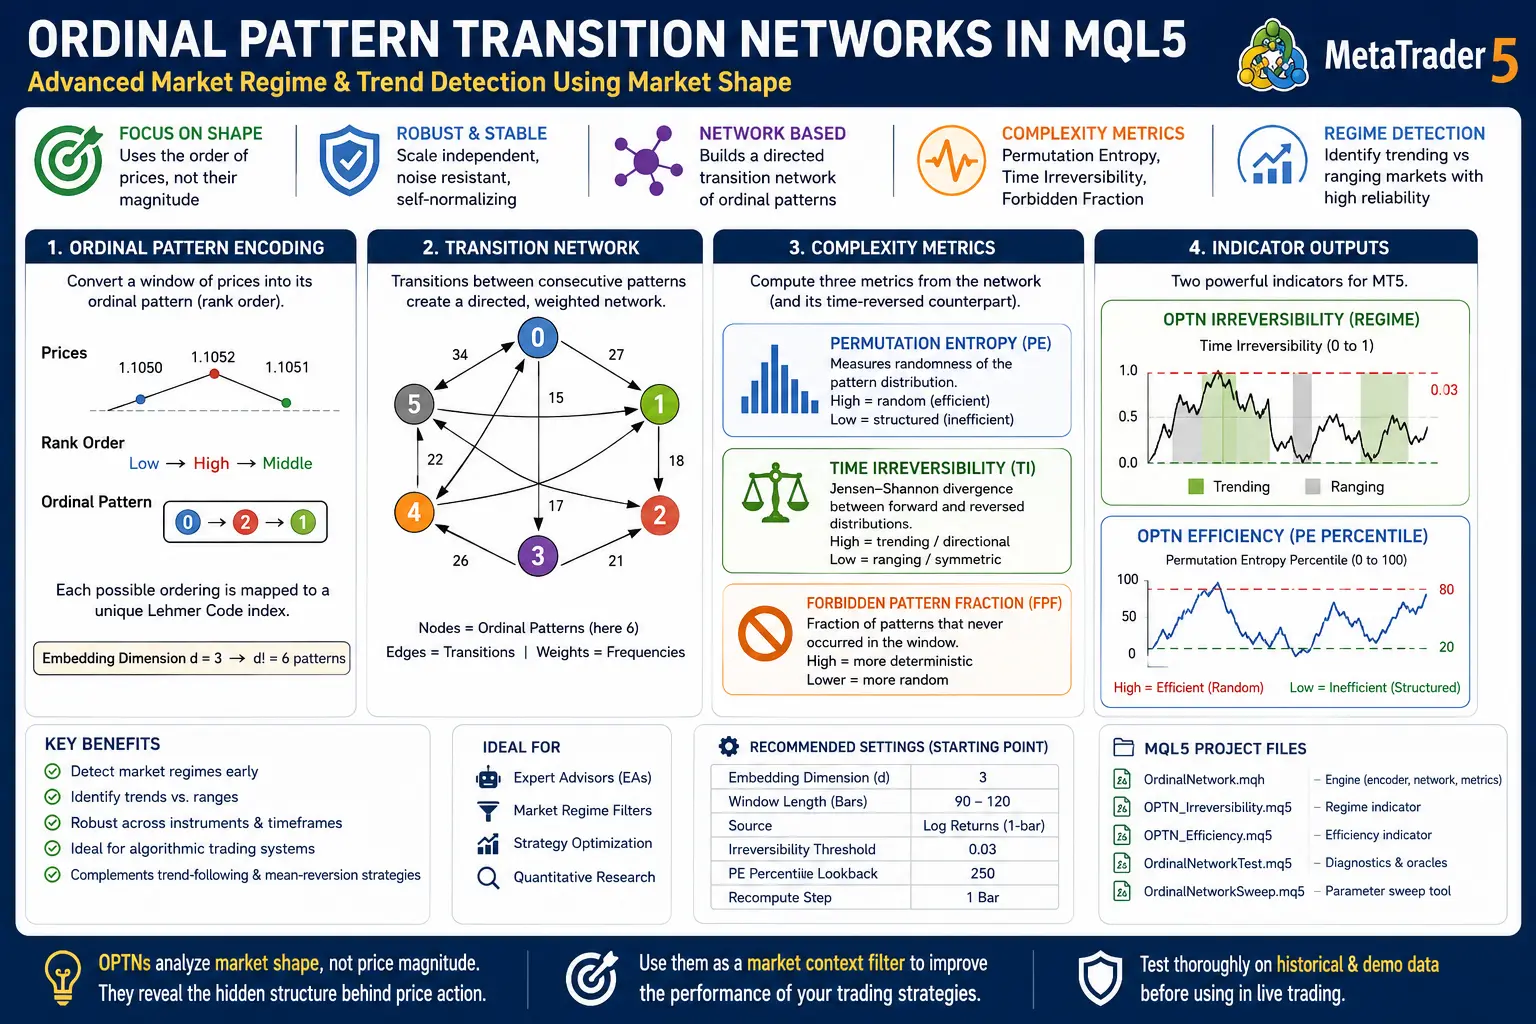
Ordinal Pattern Transition Networks in MQL5 – Advanced Market Regime Detection Using Market Shape
Introduction
Traditional technical indicators rely heavily on price magnitude. Moving averages smooth prices, oscillators measure momentum, and volatility indicators calculate statistical distance. While these approaches remain popular, they often struggle with one of the biggest challenges in financial markets—non-stationary price behavior.
Markets constantly drift, change volatility, and switch between trending and ranging conditions. This makes many conventional indicators highly sensitive to price scale and market regime.
Ordinal Pattern Transition Networks (OPTNs) provide a completely different perspective.
Instead of measuring how much price moves, OPTNs analyze how price is ordered over time.
This approach originates from nonlinear dynamics and complexity science and has been successfully applied to:
- Chaos Detection
- Climate Analysis
- EEG Signal Processing
- Network Science
- Complexity Theory
Now the same mathematical framework can be applied inside MetaTrader 5 (MT5) using MQL5 to build highly robust market regime indicators.
Rather than analyzing price levels, OPTNs transform recent market behavior into symbolic patterns and construct a directed network that reveals whether the market behaves like a random walk or exhibits persistent directional structure.

Why Use Ordinal Pattern Transition Networks?
Most trading indicators answer questions such as:
- Is price above the moving average?
- Is RSI overbought?
- Is volatility increasing?
OPTNs answer a different question:
Is the market currently behaving like a structured system or a random process?
This distinction is incredibly valuable because it helps traders decide when trend-following strategies are likely to outperform and when mean-reversion strategies may be more appropriate.
Unlike conventional indicators, ordinal methods are:
- Scale Independent
- Self-Normalizing
- Robust Against Noise
- Resistant to Price Drift
- Comparable Across Different Markets
Whether analyzing:
- EUR/USD
- GBP/USD
- XAUUSD (Gold)
- NASDAQ
- Bitcoin
- Stocks
- Commodities
the same ordinal encoding remains valid.

How Ordinal Pattern Transition Networks Work
The entire process consists of four major stages.
Step 1 – Convert Prices into Ordinal Patterns
Instead of storing raw prices, the algorithm records the relative ordering of consecutive values.
For an embedding dimension d, every rolling window becomes one ordinal symbol.
Example:
1.1050 1.1052 1.1051
becomes
Low → High → Middle
Each possible ordering receives a unique Lehmer Code index, allowing every market shape to be represented as an integer.
Step 2 – Build the Transition Network
Once every price window has been converted into an ordinal symbol, transitions between consecutive symbols are recorded.
The resulting network contains:
- Nodes = Ordinal Patterns
- Directed Edges = Pattern Transitions
- Edge Weights = Transition Frequencies
This creates a first-order Markov representation of market dynamics that captures structural relationships ignored by traditional indicators.
Step 3 – Calculate Complexity Metrics
The MQL5 engine computes three key complexity measures.
1. Permutation Entropy
Measures market randomness.
High values indicate:
- Efficient markets
- Random behavior
- Low predictability
Low values indicate:
- Structured markets
- Lower randomness
- Higher exploitable information
2. Time Irreversibility
Compares forward and reversed ordinal distributions using the Jensen–Shannon Divergence.
This metric identifies:
- Trending Markets
- Directional Regimes
- Structural Asymmetry
- Market Inefficiency
Unlike moving averages, time irreversibility measures the directionality of market dynamics, not price magnitude.
3. Forbidden Pattern Fraction
Counts ordinal patterns that never occur.
A high forbidden fraction suggests:
- Strong deterministic behavior
- Reduced randomness
- Potential market inefficiency
Although highly useful for research, this metric is generally less informative on lower-dimensional Forex datasets and is therefore kept primarily for analytical purposes.

Why Time Irreversibility Matters
Financial markets are not always random.
During strong trends, the sequence of market shapes becomes asymmetric.
If the same data are reversed in time, the resulting ordinal distribution changes significantly.
Time irreversibility measures exactly this asymmetry.
Higher values typically indicate:
- Persistent trends
- Directional market pressure
- Strong momentum
- Reduced randomness
Lower values suggest:
- Sideways markets
- Mean-reverting behavior
- Efficient market conditions
This makes time irreversibility an excellent market regime filter for automated trading systems.
MQL5 Implementation
The complete MQL5 project includes a reusable Ordinal Pattern Transition Network Engine featuring:
- Dynamic Embedding Dimensions
- Lehmer Code Encoder
- Rolling Transition Networks
- Permutation Entropy
- Time Irreversibility
- Forbidden Pattern Detection
- Reliability Validation
- Status Reporting
- Data Sufficiency Checks
The engine is designed for high performance while maintaining numerical stability across large historical datasets.
Included Indicators
OPTN Irreversibility Indicator
The regime indicator visualizes:
- Trending Markets
- Sideways Markets
- Directional Strength
- Structural Market Changes
Default settings:
- Embedding Dimension: 3
- Window Length: 90 Bars
- Source: One-Bar Log Returns
OPTN Efficiency Indicator
The efficiency indicator computes permutation entropy and displays its rolling percentile rank.
This approach highlights periods when the market becomes unusually structured relative to its recent history.
Rather than plotting nearly flat entropy values, percentile normalization transforms subtle statistical changes into highly visible trading signals.
Real-World Testing on EUR/USD
Initial testing revealed an important insight.
Raw permutation entropy remained close to its theoretical maximum, making the indicator appear almost flat.
Instead of indicating a problem with the mathematics, this reflected the near-efficient nature of major Forex markets.
Parameter optimization showed that:
- Encoding one-bar log returns instead of raw prices significantly improved sensitivity.
- Shorter rolling windows increased responsiveness.
- Rolling percentile normalization transformed subtle entropy shifts into practical trading signals.
- Time irreversibility emerged as the most reliable market regime indicator.
These findings demonstrate that proper feature engineering is often more important than changing the underlying mathematical model.


Why Traders Should Use Ordinal Pattern Networks
Unlike conventional technical indicators, OPTNs focus on market structure rather than price magnitude. This makes them especially useful for identifying transitions between trending and ranging conditions, filtering trading strategies, and improving algorithmic decision-making.
They are not intended to generate direct buy or sell signals. Instead, they provide valuable market context that can enhance existing systems such as trend-following, breakout, or mean-reversion strategies.
Conclusion
Ordinal Pattern Transition Networks represent a powerful advancement in quantitative market analysis for MQL5 developers. By transforming raw prices into symbolic ordinal patterns, constructing directed transition networks, and measuring complexity through permutation entropy and time irreversibility, traders gain a unique perspective on market dynamics that traditional indicators cannot provide.
Whether you are building Expert Advisors, custom indicators, or conducting financial research, OPTNs offer a mathematically grounded framework for detecting market regimes, evaluating efficiency, and improving strategy robustness. Combined with proper parameter tuning and rigorous testing, they become an excellent addition to any professional algorithmic trading toolkit.
FAQ
What is an Ordinal Pattern Transition Network?
An Ordinal Pattern Transition Network (OPTN) is a graph-based representation of financial time series that converts price sequences into ordinal patterns and analyzes transitions between them to detect market structure and complexity.
What is permutation entropy in MQL5?
Permutation entropy measures the randomness of ordinal pattern distributions. Higher values indicate efficient, random markets, while lower values reveal structured and potentially predictable behavior.
Why is time irreversibility important for trading?
Time irreversibility quantifies the asymmetry between forward and reversed market dynamics. High irreversibility often signals trending markets, while low values indicate ranging or random conditions.
Can OPTNs improve Expert Advisors?
Yes. Although OPTNs do not generate direct trade signals, they serve as powerful market regime filters that can improve the performance of Expert Advisors by identifying favorable market conditions.
Which markets can use Ordinal Pattern Transition Networks?
OPTNs are suitable for Forex, Stocks, Indices, Commodities, Cryptocurrencies, and other financial instruments because they analyze relative price ordering rather than absolute price levels.